Task
Compare two ways of completing the same defined job. One may use a less expensive model and need more attempts. Another may return useful results more often but still need human review. The request price alone cannot settle the comparison.
Start with the acceptance rule from your evaluation. It should say what a usable outcome requires: correct fields, grounded claims, an allowed action, or another criterion that matters to the work. Cost per accepted result only means something when “accepted” stays consistent.
Method
For a planning estimate, separate machine attempts, review, and fixed overhead. Treat a task as a requested job and an attempt as a model call or run spent on that job. A retry adds an attempt, not another successfully completed task.
Machine cost = tasks × attempts per task × cost per attempt
Review cost = tasks × review minutes per task ÷ 60 × hourly cost
Accepted results = tasks × acceptance rate
Cost per accepted result = total cost ÷ accepted results
Choose the scope of your per-attempt cost carefully. If it includes tool calls, do not add them again elsewhere. If it only includes model tokens, add the other operating costs to fixed overhead or a more detailed ledger. Review time in this simple method is the total per requested task, including failed attempts.
An illustrative result
Suppose there are 1,000 requested tasks, 1.2 attempts per task, and a cost of $0.01 per attempt. Machine cost is $12. At two review minutes per task and $30 per hour, review adds $1,000. With no fixed overhead and an 80% acceptance rate, total cost is $1,012 for 800 accepted results: approximately $1.27 each.
Those numbers are deliberately hypothetical. They are not a vendor quote or a report from a tested workflow. Change the inputs in the accepted-result calculator to see the arithmetic for your own assumptions.
What to compare alongside cost
The HELM research includes efficiency among multiple evaluation dimensions. Our practical extension is to pair an economic calculation with the quality rule that defines success. A lower cost that comes from accepting worse answers is a different tradeoff, not a like-for-like saving.
Record the rate of escalation, the kinds of errors, and the time to a useful result. Consider whether staff time is actually freed for other work. Time valued on a spreadsheet is not automatically cash saved, and some errors have consequences the simple formula cannot express.
Scroll sideways to inspect the full diagram
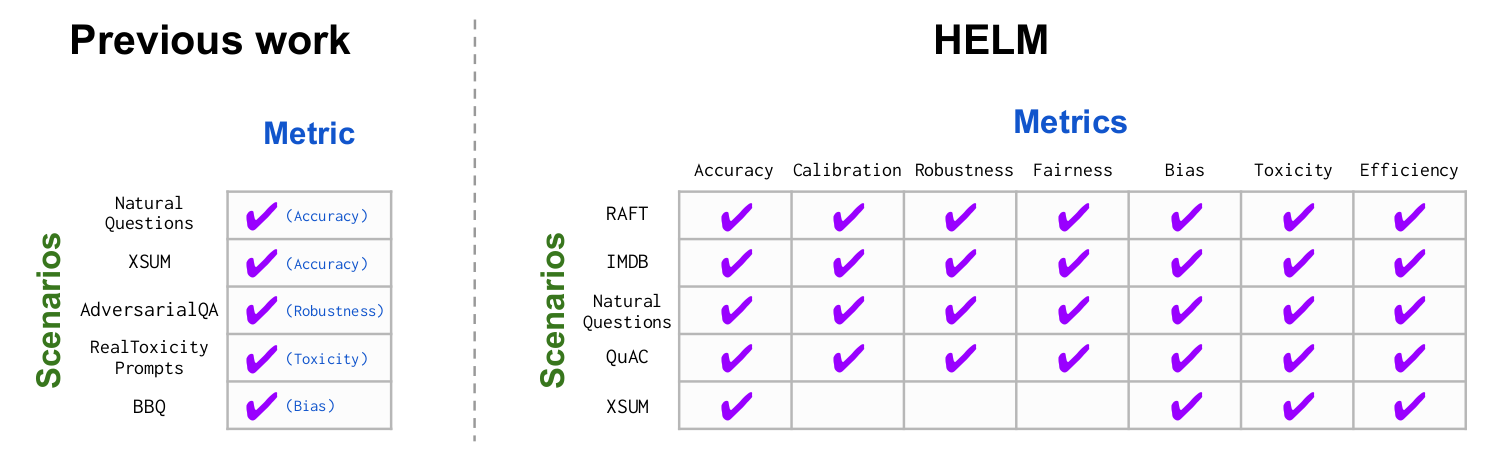
HELM’s original diagram makes the evaluation dimensions visible. The checks describe evaluation coverage in this historical illustration; they are not model scores.
Source: Stanford CRFM · 17 November 2022 ↗Limits
This calculation does not model taxes, uncertain demand, queueing, cash flow, or the full consequences of an incorrect result. A zero acceptance rate produces no meaningful per-accepted-result figure. Use measured inputs where possible and keep estimated inputs labeled. Revisit the record when the model, prompt, workflow, or review process changes.
Sources & reading trail
- Holistic Evaluation of Language Models — methodological context for assessing efficiency alongside other properties.
- Model Cards for Model Reporting — context for documenting intended uses and evaluation conditions.
The accounting formula and dollar example are original illustrative arithmetic based on the project’s task-economics framework. They are not prices or measured model results.